Reference: Discovering User Connections using Their Shared Images on Social Media [V1]
Abstract
Human beings are born social. In the social media era, we share and interact with others digitally, forming online social graphs and sharing billions of images. Many social media applications, such as recommendation, virality prediction, and marketing, make use of social graphs as similar users (e.g., users with similar interests) tend to be friends. However, the social graph may not be explicitly specified by users or may be kept private due to privacy concerns. Meanwhile, billions of user-shared images are shared by individuals, and the images are widely accessible to others due to their sharing nature. These user shared images are proved to be a more effective alternative to discover user connections. This thesis introduces a novel way to detect social signals from low level visual features, and to represent them with unbiased machinegenerated labels to discover user connections. Based on 11 million user-shared images from 11 real social media platforms, a phenomenon exists that related users who have online friendships or follower/followee relationships on those platforms share more similar images. This phenomenon is independent of the network origins, the content sharing mechanisms and the image processing/computer vision techniques that encode the images. Hence, an analytic framework is proposed to measure, formulate and utilize the phenomenon for follower/followee recommendation. The framework is optimized for social signal detections using deep learning. Different applications are also discussed. To the best of our knowledge, this framework is the first attempt to discover connections by detecting social signal from user-shared images.Dataset
The images are collected from a set of randomly selected users from each social network by either the official API (Twitter, Skyrock, 163 Weibo and Tencent Weibo), or by a ruby-based web scraper (Flickr, Pinterest, Duitang and Digu). The details of those images are shown in the table. As the number of maximum requests (the number of images to be downloads) is limited by the operators of the social networks, the user generated images are collected in parallel with virtual machines installed on Cloud platforms such as Amazon EC2. They are downloadable at the end of the page.| origins | social networks | user shared images | min/mean/median/max size of images (KB) |
|---|---|---|---|
| US | Flickr | 201,006 | 2.1/193.8/178/1960 |
| US | 314,369 | 0.671/77.1/51.4/1020 | |
| US | 150,696 | 0.338/58.5/41.3/1340 | |
| France | Skyrock | 176,547 | 0.0684/75.4/37.1/9020 |
| China | Duitang | 396,534 | 0.947/116/68.2/6910 |
| China | Digu | 148,337 | 0.181/179/86.0/14400 |
| China | 163 Weibo | 187,491 | 0.0791/102/56.4/7500 |
| China | Tencent Weibo | 490,624 | 0.616/37.2/26.3/963 |
| Total | 2075604 |
Data Processing and Storing
The scraped user-generated images are processed with ResNet as vectors.
There are 2 millions user shared images from 8 social networks. They are encoded by ResNet, by taking the last layer before the 'softmax' layer.
The data of each social network contains 3 files:
- 1) x.mat: encoded images
- 2) dataFd.mat: follower/followeree relationships
- 3) dataImageBy: uploader of all images.
Note that the id of an images in 'dataImageBy' starts with '2', while the id if a user start with '3'. For example:
"200150685,373741227"
it means that the 150685-th image in 'x.mat' is shared by user '373741227', and the relationship of this user can be found in dataFd.mat.
Download
163: 1. Friends 2. Data 3. User-data Relationship
Daitung: 1. Friends 2. Data 3. User-data Relationship
Digu 1. Friends 2. Data 3.User-data Relationship
Flickr 1. Friends 2. Data 3.User-data Relationship
Pinterest 1. Friends 2. Data 3. User-data Relationship
Skyrock 1. Friends 2. Data 3. User-data Relationship
Tencent 1. Friends 2. Data 3. User-data Relationship
Twitter 1. Friends 2. Data 3. User-data Relationship
Please contact us for more data and collaborations (email: cpming@ust.hk)Research Chanlleges
Based on machine-generated labels, an analytic framework that acts as a social signal detector to discover user connections from shared images is proposed. A set of images is first encoded with some image processing and computer vision techniques, such as CNN, into vectors with \(R\) dimensions. Then the vectors are clustered by clustering techniques, such as \(k\)-means. Each cluster corresponds to a machine-generated label. Those labels represent the social signal, such that images shared by related users are more likely to be in the same cluster. The user profile, or the label distribution, is built from the occurrences of machine-generated labels. When the user profile is obtained, the next step is to discover user connections from the similarity of their label distributions. The user profile reflects the interests, connections and behaviors of a user. For example, a pair of users is more likely to be follower/followee, of the same gender, and/or have similar interests when their user profiles are more similar. The same profile can be used to predict multiple information and interests. Hence, applications can be based on those discovered connections, even without access to SGs.
Based on the proposed framework, the first research objective is to evaluate whether the framework is applicable to any social media, regardless of its origins, content sharing mechanisms and image encoding techniques. The second objectives is to propose an analytics to formulate and utilize the proposed framework. The third objective is to optimise the proposed framework for social signals detection for image encoding from user-shared images. The forth objective is to extend the framework to applications of the proposed framework. These objectives are introduced in the coming chapters. The next section discusses the collected datasets from different social media applications used in the experiments.
Data Analytics
The figure below shows the proposed analytical framework. Each image, \(x_m\), will be encoded into an output feature vector, \(f(x_m)\) using some image processing and computer vision techniques, as shown in step 1. The feature vectors, \(f(x_m)\), of the user-shared images from every user are clustered into \(K\) clusters, and annotated by some unique machine-generated label that represents the cluster it belongs to, as shown in step 2 in the figure. A user $i$ is then profiled by a \(K\)-dimension vector, \(L_i\), that describes the distribution of \(K\) unique labels tagged on the images shared by this user.
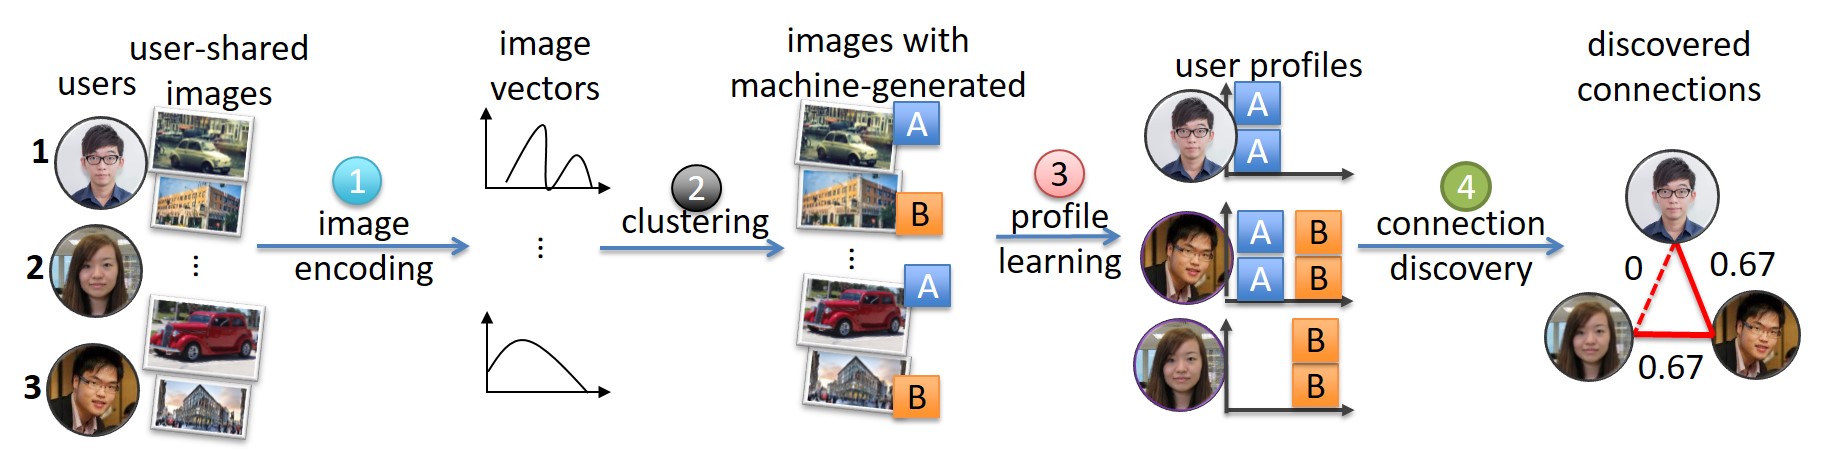
Given the profiles, \(L_i\) and \(L_j\), of users \(i\) and \(j\) respectively, the similarity of users \(i\) and \(j\), \(S_{i,j}\), can be evaluated through their shared images by:
\(S_{i,j} = \frac{L_i \cdot L_j}{||L_i|| ||L_j||}\)
where \(\cdot\) is the dot product of 2 vectors and \(||.||\) is the L2 norm of a vector.
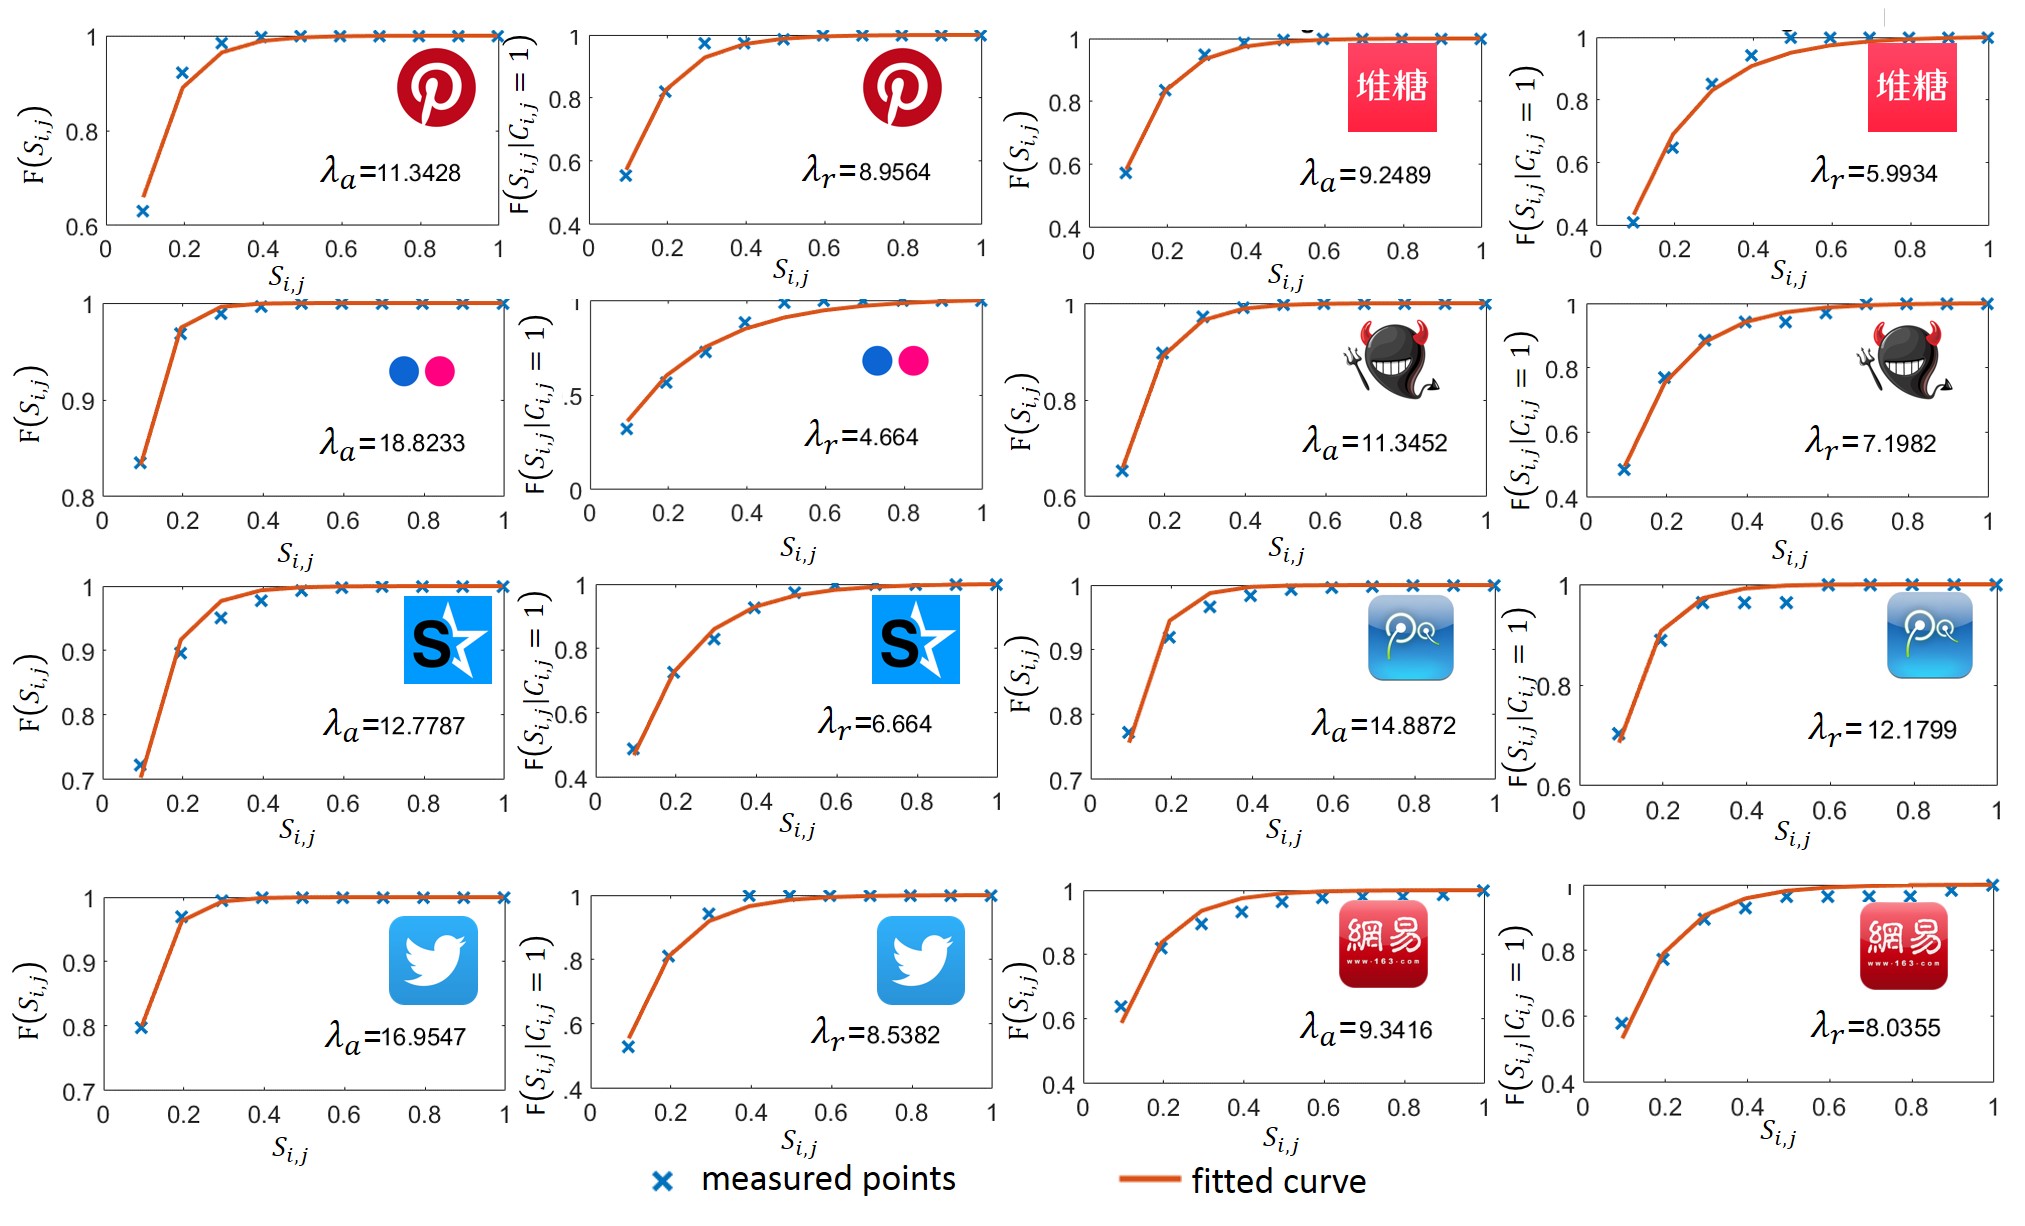
Data Measurement